Visualize Measurements
Using GATorch you can track the energy consumption of your models. To visualize the results
you can use the visualize_data() function.
from GATorch import GA

ga_measure = GA()
ga_measure.attach_model(model)
train(model)

ga_measure.visualize_data()
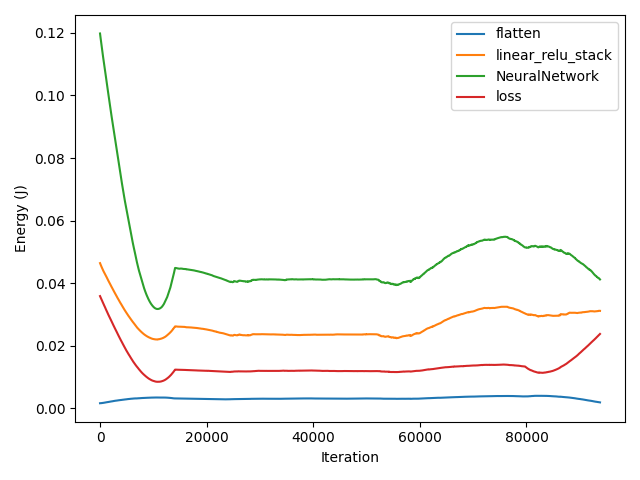
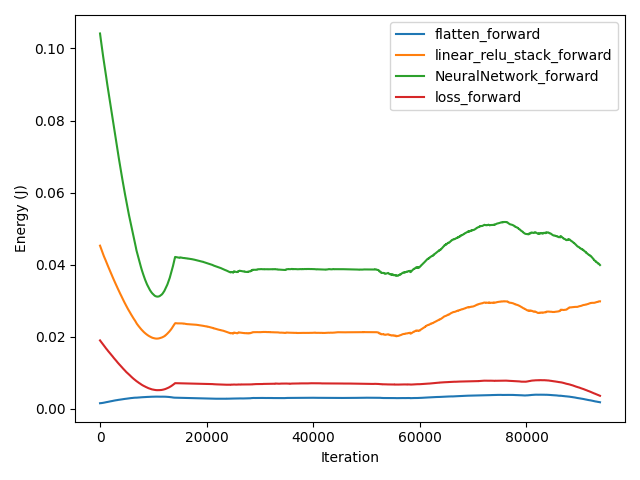
You can use the function to specify if you want to see the energy consumption of the model during a forward pass or a backward pass. Furthermore if you attached also a loss function to the profiler you can also see the consumption of the loss computation. Finally you can specify which named layers you are intrested in seeing.
ga_measure.visualize_data(layers=[], loss=True, phase='forward')
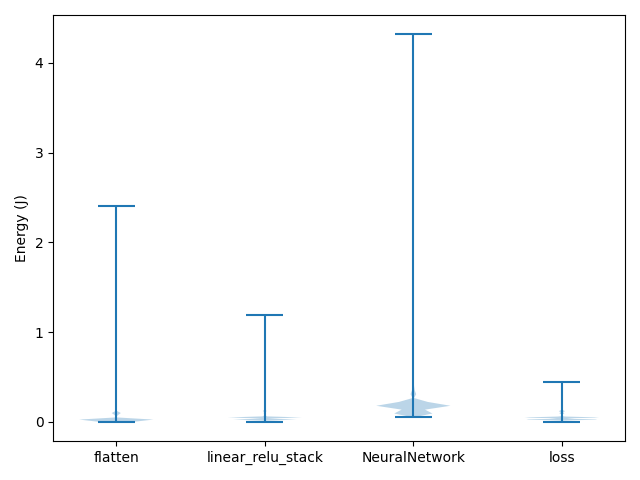
If you are intrested in seeing the distribution of energy consumption the model consumes during a batch pass you can also visualize a violinplot or a boxplot.
ga_measure.visualize_data(kind='violin', loss=True)